A Quality Score on Every Row
KC Star V4 puts a DataQualityScore on every dimension and fact, defaulting to a perfect 1.0 and downgrading only on evidence. Here is the opt-out philosophy, the assessment procedures behind it, and the one query that finds every row the warehouse doesn't quite trust.
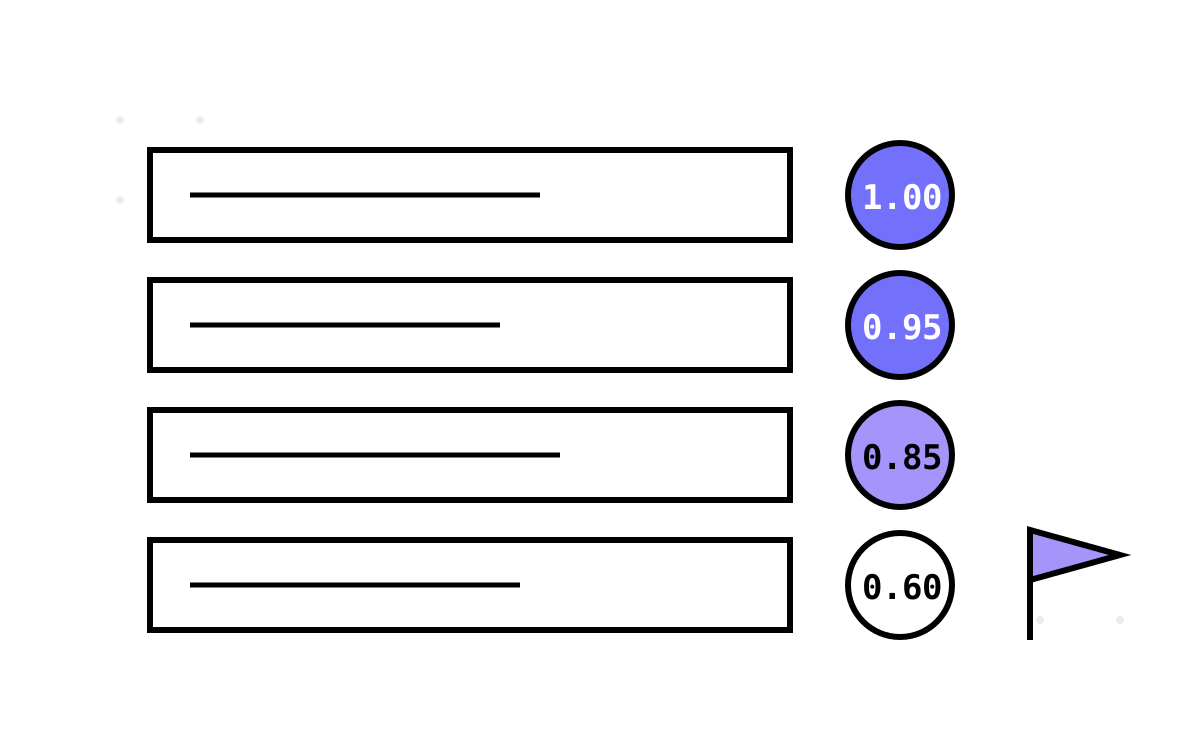
The conscience V4 grew has a number attached to it: DataQualityScore, a DECIMAL(3,2) on every dimension and fact row. This post is about that one column — the opt-out philosophy baked into its default, the procedures that assess it, the provenance columns that ride alongside it, and the single query that turns the whole idea into something operationally useful: show me every row the warehouse does not fully trust.
Trust by default
The column is declared identically everywhere it appears:
DataQualityScore DECIMAL(3,2) DEFAULT 1.0
Three digits, two after the decimal — a score from 0.00 to 1.00. And the default is 1.0: a perfect score, assumed until contradicted. This is the opt-out model. A row does not have to earn its quality; it starts trusted and gets downgraded only when something flags it.
I want to defend that choice, because the alternative is seductive and wrong for this system. You could default to 0.0 and make every row prove its quality before it counts — quality as opt-in. But in a warehouse where the overwhelming majority of data is fine, opt-in quality means almost every row sits at zero waiting for a validator that mostly rubber-stamps it, and a low score stops meaning “suspect” and starts meaning “unprocessed.” The opt-out default keeps the signal clean: a score below 1.0 is a positive statement that something noticed a problem. Silence means healthy. That is the semantics I wanted.
You can see it in the SCD2 examples, where a manual correction to a value deliberately stamps a slightly-reduced score:
UPDATE SalesDim
SET DimValue = '150.00', DataQualityScore = 0.95
WHERE SalesReferenceId = 4 AND DimTypeId = 3 AND IsCurrent = TRUE;
A human-edited value is marginally less trusted than a system-generated one — 0.95, not 1.0 — and that half-a-nudge is exactly the kind of thing the score exists to record.
Assessment, as a procedure
Scoring is not only manual. V4 ships a AssessDataQuality procedure (one of five governance procedures, alongside ProcessBatch, TrackDataLineage, MonitorPerformance and ValidateDataIntegrity) that walks the data applying quality rules and writing scores. You invoke it as a governance pass:
CALL AssessDataQuality();
The results roll up through a DataQualitySummary view, which aggregates scores so you can see the health of the warehouse at a glance rather than row by row. The view distinguishes dimension quality from fact quality and counts how many rows fall below a threshold — the kind of summary a governance dashboard would sit on top of.
Provenance rides along
Quality is more useful when you know where a row came from, so V4 adds two provenance columns next to the score on both dimensions and facts:
SourceSystem— which system produced this row. Defaults vary by layer ('SYSTEM'for the core sales data), and later versions use distinct defaults per subsystem so the origin is baked into the data.BatchId— which load or process wrote it, tying a row to a processing run.
Together, DataQualityScore, SourceSystem and BatchId turn a bare value into a value with a provenance record: how much we trust it, where it came from, and which run produced it. That triple is the governance minimum — you cannot manage quality you cannot attribute.
The query that matters
All of this earns its keep in one operational question: which rows should a human look at? The usage examples answer it directly, and it is the query I would pin to a monitor:
SELECT Id, SaleType, AvgDataQualityScore, TotalSale, NetRevenue
FROM CurrentSalesState
WHERE AvgDataQualityScore < 0.9
ORDER BY AvgDataQualityScore ASC;
Because a sale is many dimension rows, the view aggregates their scores into an AvgDataQualityScore per sale. The WHERE AvgDataQualityScore < 0.9 filter surfaces exactly the sales where at least one dimension got flagged, worst first. In the opt-out model this list is meaningful by construction: everything on it has a reason to be there, because nothing lands below 1.0 without a downgrade. A clean warehouse returns zero rows. A warehouse with problems returns a prioritised worklist.
You can slice quality by any grouping you already have — here, by sale type:
SELECT SaleType, COUNT(*) AS SaleCount,
       AVG(AvgDataQualityScore) AS AvgQualityScore,
       SUM(TotalSale) AS TotalSales
FROM CurrentSalesState
GROUP BY SaleType
ORDER BY SaleType;
Now quality is a business dimension: if 'Online' sales consistently score lower than 'Store' sales, that points at a specific ingestion path, not a vague unease.
The honest limit
I will not oversell this. The DataQualityScore is a single scalar standing in for a genuinely multi-dimensional idea — completeness, accuracy, timeliness, consistency all collapsed into one number between zero and one. A 0.85 does not tell you why the row is suspect, only that it is. The CalculationContext from part 4 helps on the fact side by recording inputs, but the dimension score is blunt.
For V4's purpose — making quality visible and queryable where before it was invisible and assumed — a blunt scalar is the right first move. You cannot manage what you cannot see, and a single number you can filter on beats a rich quality model nobody populates. Refining what the number means is future work; V4's contribution is that the number exists at all, on every row, and that a query can find the rows worth worrying about.
Next: the other half of provenance. Where a quality score says how much to trust a row, lineage says where it came from — and V4 implements it two entirely different ways.