The Scheduler That Reads Its Own Health
KC Star V7 scores its own health from queue depth, processing time and success rate, then maps that score to a batch cadence - from 30 seconds when healthy down to emergency mode when critical - and writes the decision back into its own settings. Clever, and honestly limited.
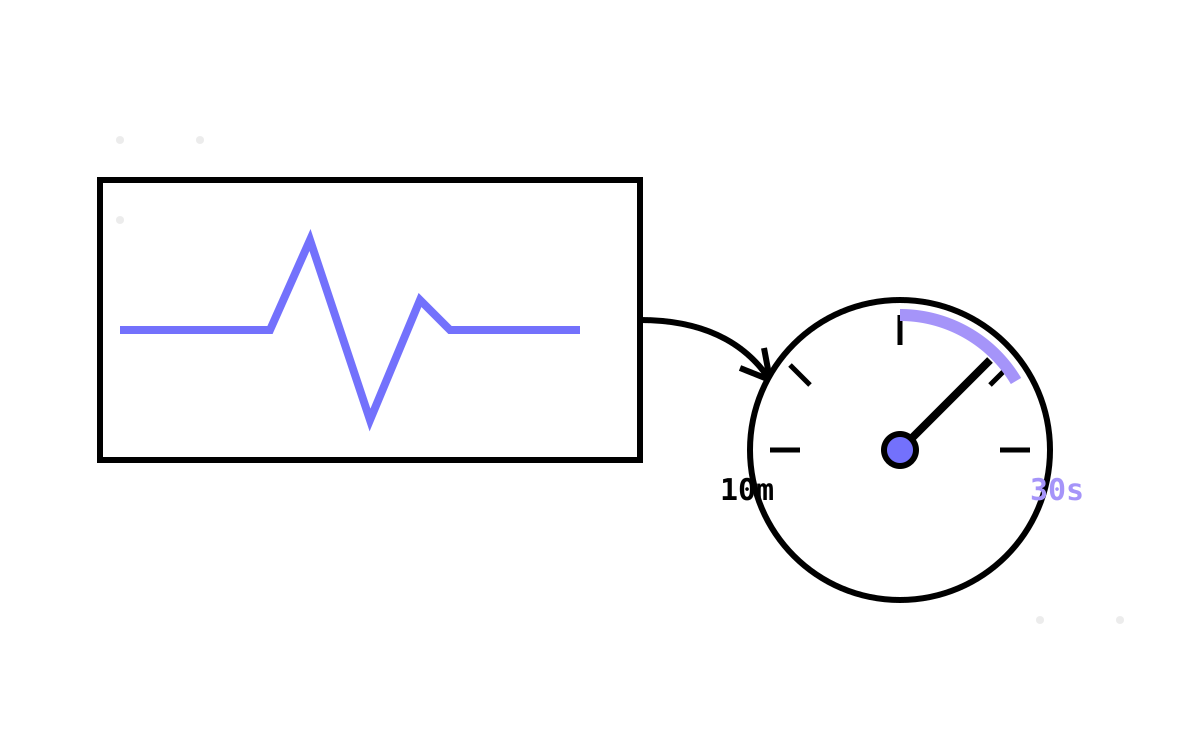
Most schedulers run on a fixed cadence: every thirty seconds, every five minutes, whatever you configured. V7's batch scheduler does something more interesting and slightly unnerving — it reads its own health and retunes its own cadence in response. Healthy and keeping up? Run often with big batches. Falling behind or straining? Slow down, shrink the batches, drop into emergency mode. And it writes the decision straight back into the feature settings it read from. This post is that self-adjusting loop, and an honest account of what its “health” actually measures — which is less than the marketing implies.
Scoring the warehouse's health
The loop starts with CollectSystemHealthMetrics, which gathers a set of signals and scores each 0–100 with a HEALTHY / WARNING / CRITICAL band. The metrics it collects:
UnprocessedSalesandUnprocessedEmployeeSales— how deep the batch queue is.BatchProcessingHealth,AverageProcessingTime,SuccessRate— how the recent batches performed.SystemLoad— a composite score.DatabaseSize(viapg_total_relation_size) andConnectionUtilization(frompg_stat_activityagainstmax_connections).
The composite SystemLoadScore starts at 100 and subtracts penalties: minus 20 for a deep queue, minus 15 for slow processing, minus 25 for a low success rate, minus 10 for high connection use. What is left is a single number standing for “how healthy is the pipeline right now.”
Mapping health to cadence
The clever part is DetermineOptimalBatchSchedule, which takes that health score plus the queue depth and returns a recommended (interval, batch size, max processing time). It is a banded lookup:
-- conceptually, inside DetermineOptimalBatchSchedule
IF health_score >= 90 AND unprocessed <= 100 THEN
    RETURN (30 seconds, 2000, 60 seconds);   -- 'System healthy - optimal performance'
ELSIF health_score >= 70 THEN
    RETURN (1 minute,  1500, 45 seconds);
ELSIF health_score >= 50 THEN
    RETURN (2 minutes, 1000, 30 seconds);
ELSIF health_score >= 30 THEN
    RETURN (5 minutes,  500, 20 seconds);
ELSE
    RETURN (10 minutes, 250, 15 seconds);    -- 'System critical - emergency mode'
END IF;
Read it top to bottom and it is a policy in code. A healthy, caught-up system runs every 30 seconds with 2000-row batches — aggressive throughput, because it can afford it. As health degrades, the interval stretches and the batch size shrinks, all the way down to a defensive 10-minute / 250-row emergency mode for a system in trouble. The logic is that a struggling database should be asked to do less, less often, so it can recover rather than being pounded by the very pipeline that is straining it.
There are override rules layered on top: more than 10,000 sales queued triggers a catch-up mode regardless of score; an average processing time over 10 seconds or a success rate under 90% forces the defensive band; high connection utilisation nudges it slower. The overrides handle the cases where a single signal is alarming even when the composite score looks acceptable.
The loop closes on itself
Here is the part that makes it a self-adjusting system rather than just a recommendation engine. UpdateBatchProcessingSchedule takes the recommendation and writes it back into the feature settings:
PERFORM SetFeatureSetting('AUTOMATED_MONITORING_ENABLED', 'SCHEDULE_INTERVAL', v_interval);
PERFORM SetFeatureSetting('AUTOMATED_MONITORING_ENABLED', 'BATCH_SIZE', v_batch_size);
PERFORM SetFeatureSetting('AUTOMATED_MONITORING_ENABLED', 'MAX_PROCESSING_TIME', v_max_time);
The whole cycle — RunAutomatedMonitoring — chains it together: collect metrics, raise any alerts, compute the optimal schedule, write it back, log it. Because the batch settings live in a table (the reason the feature-flag model is table-backed, not code), the scheduler can rewrite its own configuration at runtime and the next batch reads the new values. The system observes itself and reconfigures itself, on a five-minute monitoring interval, with no human in the loop.
Alerts, with cooldowns
Alongside scheduling, the monitoring layer raises alerts. CheckMonitoringAlerts emits MonitoringAlerts rows for CRITICAL or WARNING metrics in the last five minutes and for any batch that logged Failed in the last hour — each guarded by a NOT EXISTS cooldown so it does not re-raise the same alert while an identical one is still ACTIVE. The cooldown is the difference between a monitoring system and an alarm that screams continuously; without it, one persistent problem becomes a thousand duplicate alerts.
What “health” actually measures
Now the honesty, because this is where the feature is easy to oversell. The README talks about CPU, memory and disk thresholds — HEALTH_THRESHOLD_CPU, HEALTH_THRESHOLD_MEMORY, HEALTH_THRESHOLD_DISK are documented settings. But CollectSystemHealthMetrics does not read any actual OS telemetry. There is no CPU metric, no memory metric, no real disk-pressure signal. What it has are proxies derived from inside PostgreSQL: pg_stat_activity for connection counts, pg_settings.max_connections for the ceiling, pg_total_relation_size for table sizes, and the batch log for processing stats.
That is a meaningful limitation. Connection utilisation is a decent stand-in for load, and queue depth is a genuine signal, but “the system is healthy” is being inferred from database-internal proxies, not measured from the machine. A host pinned at 100% CPU by something outside PostgreSQL would not register — the scheduler would happily stay in its 30-second aggressive mode while the box melted. The health score is a reasonable heuristic assembled from the signals SQL can see; it is not real observability, and the documented CPU/memory/disk thresholds describe a capability the code does not have.
I would not present the self-adjusting scheduler as more than it is: a neat, genuinely useful control loop built on proxy signals. It will correctly back off when the queue is deep or batches are failing — the things it can actually see. It will not save you from resource pressure it cannot measure. For a warehouse, the visible signals are most of what matters, so the heuristic earns its keep; but calling pg_stat_activity-derived numbers “system health” oversells what is really queue-and-batch health with a couple of database-size proxies attached.
Clever, and honest about it
The self-tuning scheduler is my favourite piece of V7's ambition and the one I am most careful about. The idea — score health, map it to cadence, write the decision back into runtime settings — is genuinely good, and the banded policy from aggressive to emergency is exactly how you want a pipeline to behave under varying load. The implementation is bounded by what SQL can observe about the host it runs on, which is less than the docs claim. Both of those are true, and a fair account of V7 holds them together: it built a real self-adjusting loop on heuristic health signals, and it slightly overstated what the signals were.
The next subsystem is the one the scheduler keeps deferring to with its PARTITIONING_ENABLED checks: partitioning, where V7 tries to age cold data off the hot tables — and, being V7, tries it two overlapping ways at once.