Flow Metrics and Little's Law
The queue mathematics underneath delivery - one equation from 1961, Scaled Agile's six flow metrics rewritten in plain terms, and why the biggest delivery gains hide in the waiting rather than the working.
Part 8 ended at a boundary. DORA's instruments switch on when a commit exists: from that moment they will tell you how fast the pipeline moves and how often it breaks. But by the time a work item produces its first commit, it is usually already old. It has queued in a backlog, waited for refinement, waited to be picked up, and it will go on waiting — for review, for a dependency, for an environment — at every step after. Measuring that whole journey, from “asked for” to “in the customer's hands”, needs a different set of instruments, and underneath all of them sits a single piece of mathematics that predates the software industry's interest in the question.
The equation older than the dashboards
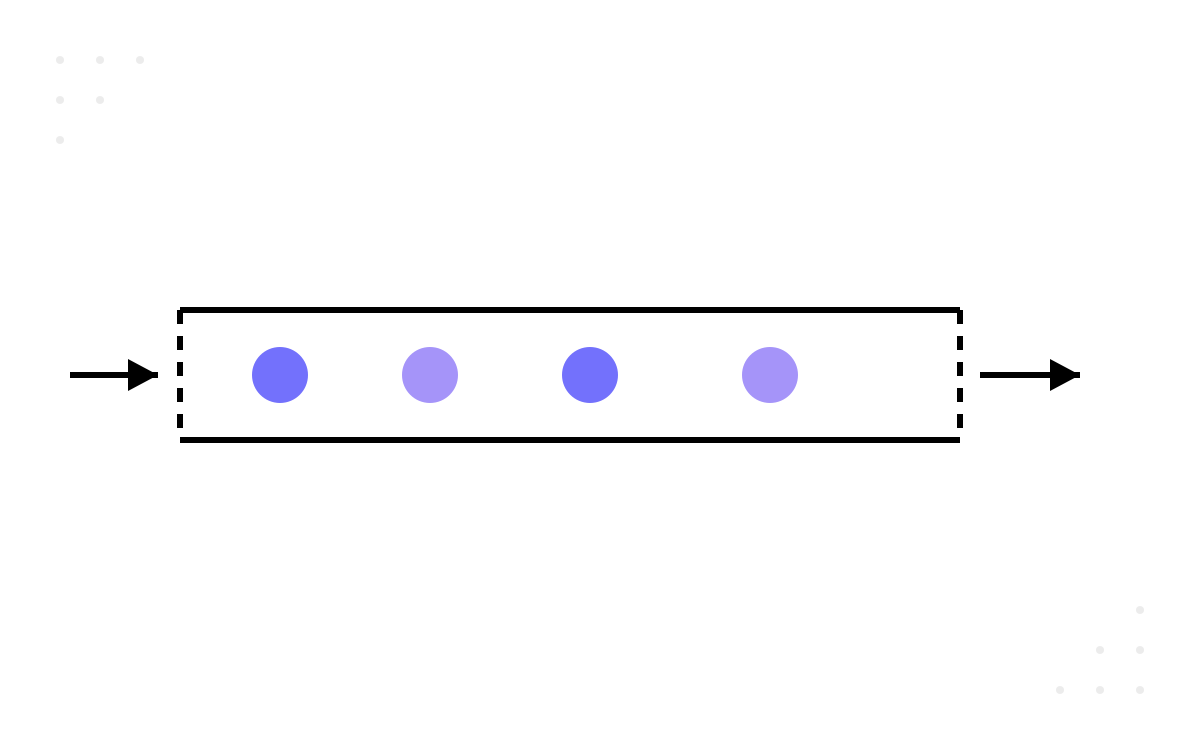
In 1961, John D. C. Little proved a result in queueing theory that has been quietly governing your delivery ever since, whether or not anyone measures it. In its textbook form: the average number of items inside a stable system equals the rate at which items arrive multiplied by the average time each item spends inside. Rearranged into delivery vocabulary, flow time = flow load divided by flow velocity — W = L/λ, with the queue's contents on top and its throughput underneath.
What makes Little's Law remarkable is what it does not require. It does not care how the items are ordered, how big they are, how the arrival times are distributed, or what your process looks like inside the box. It requires only stability — that over the window you measure, the team finishes work at roughly the rate it starts work. Under that one condition, the three quantities are welded together. You do not get to choose two and negotiate the third.
Run the arithmetic on an invented team — call them Meridian. They complete ten items a week and habitually carry thirty items in flight. Little's Law prices that habit immediately: thirty divided by ten is an average of three weeks from start to finish, before anyone has said a word about how hard the team works. Now hold their velocity exactly where it is and halve the load to fifteen. Average flow time falls to a week and a half. Nobody typed faster, nobody worked evenings; the team simply stopped starting things it could not yet finish. Reducing work in progress is the only delivery lever that requires no new skill, no new tooling and no budget — just the nerve to leave work unstarted. My own working ceiling, offered as practice rather than research, is two items in progress per person; past that, in every team I have run the numbers for, the context-switching tax shows up in the flow time before the sprint is out.
Whose vocabulary this is
The measurement vocabulary most organisations use for this territory belongs to someone. Scaled Agile's SAFe framework defines six flow metrics — Flow Velocity, Flow Time, Flow Efficiency, Flow Load, Flow Distribution and Flow Predictability — in its Measure and Grow guidance. SAFe is a commercial framework and a registered trademark of Scaled Agile, Inc., so the ground rules from part 1 apply with extra force here: the six names are their terms, credited as such, and every definition in this article is my own wording of what I use the metric for — not a restatement of theirs. For scale of adoption you have only the vendor's own figure: Scaled Agile says 70 of the Fortune 100 have SAFe-certified professionals, which I pass on as their claim about their own reach, nothing more.
The ideas are older than the branding, and the lineage deserves naming. Mik Kersten's Flow Framework, laid out in Project to Product (2018), put flow-based measurement of value streams into mainstream engineering management, building on Don Reinertsen's product-development flow principles — the queues-and-batches school of thinking that Little's Law anchors. SAFe's six metrics stand on that foundation.
Three dials and one law
The first three metrics are Little's Law wearing name badges.
Flow velocity is the count of items finished per period. Finished, not started, and not in progress — this is a done-ness dial, and it is deliberately indifferent to effort. Ten items completed is ten, whether they were easy or brutal. Its useful reading is the trend: is the finishing rate rising, flat or sinking?
Flow time is the elapsed calendar clock from the moment an item enters the value stream to the moment it reaches the customer — nights, weekends and every queue included. This is the number the person who asked for the work actually experiences. They did not see your sprint boundaries; they saw the date they asked and the date they received.
Flow load is how many items are in flight right now — work in progress, counted at the level of the whole system rather than one person's task list.
Because the law binds them, these three are one instrument with three faces. If load rises and velocity does not, flow time is already rising — the customers just have not felt it yet. Which is also why load is the special dial of the three: velocity and flow time can only be influenced, but load can be decided, tomorrow morning, by declining to start the next item.
The waiting is most of the elapsed time
Flow efficiency asks what fraction of an item's flow time was spent being actively worked on, as opposed to sitting in a queue. The figure that circulates deserves careful handling: flow practitioners commonly report efficiencies between 5% and 15%, but that range comes from practitioner literature rather than any controlled study, so hold it as field folklore with a plausible shape, not as a benchmark. What I can say from my own estates is that the first time a team measures this honestly, the result is almost always embarrassing — and clarifying.
Because if anything like that ratio holds for you, the strategic consequence is blunt: most of your delivery time is waiting, so speeding up the work attacks the small slice while the large one — review queues, approval gates, dependency waits, “assigned but not started” — goes untouched. The improvement programme that follows from flow efficiency looks nothing like the one that follows from velocity charts. It is queue surgery, not exhortation.
One honesty note before you put this on a dashboard: computing it requires knowing how long each item sat in each state, and that is exactly the data most tooling does not hand you by default. Part 11 deals with the capture mechanics.
Where the work actually went
Flow distribution is the split of completed work across the kinds of demand competing for the team. Scaled Agile's taxonomy names four flow-item categories — features, defects, debt and risk — and three investment horizons it calls Explore, Exploit and Sustain; I will credit those names to the framework and leave their formal definitions to it. What I use the underlying idea for is a single comparison: the split you planned against the split you shipped. A team that intends three-quarters feature work and delivers half of that, with the balance eaten by defect fixes, does not have a scheduling problem — it has a quality problem wearing a scheduling costume, and no amount of velocity coaching will fix it. Distribution is the dial that catches strategy being quietly overruled by reality, quarter after quarter, while every other number looks stable.
Promises with error bars
Flow predictability is the gap between what was committed for a period and what actually arrived, tracked across periods. My definition, my framing: it measures the error bars on your promises. It matters because other people plan against your dates — marketing, support, other teams — and a team that delivers 60% of its commitment one sprint and 130% the next is unplannable even when its average is respectable.
It is also the flow metric most exposed to the part 1 mechanism. Make predictability a target and teams will hit it by the obvious route: promising less. Sandbagged commitments produce beautiful predictability charts and a slowly shrinking organisation. Read it diagnostically — why did the plan and the outcome diverge? — and it earns its place; score teams on it and it will lie within the quarter.
What the flow dials cannot see
Six metrics, then, resting on one theorem: velocity, time and load bound by Little's Law; efficiency exposing the queues; distribution auditing where the capacity really went; predictability pricing the promises. Together with DORA's five from part 8, that is a reasonably complete instrument panel for the work.
And that is precisely its limit. Every dial in this part counts work items. None of them asks whether the people moving those items are thriving, burning down, or quietly updating their CVs — and a delivery system that measures only the work will happily optimise itself into that blindness. Next, the framework built to name what the flow dials miss: SPACE and the human dimensions.