The Misleading-Metrics Graveyard
Eleven numbers that still haunt engineering dashboards - what killed each one, from Goodhart to queueing theory to changing fashion, and the one-line replacement carved on every headstone.
Newest first, grouped by year. Search or filter by topic.
Eleven numbers that still haunt engineering dashboards - what killed each one, from Goodhart to queueing theory to changing fashion, and the one-line replacement carved on every headstone.
The team, the team lead and the executives need different slices of the same truth - what each audience should actually see, the numbers I put in front of a boardroom, and dashboard principles that skip the red-amber-green pantomime.
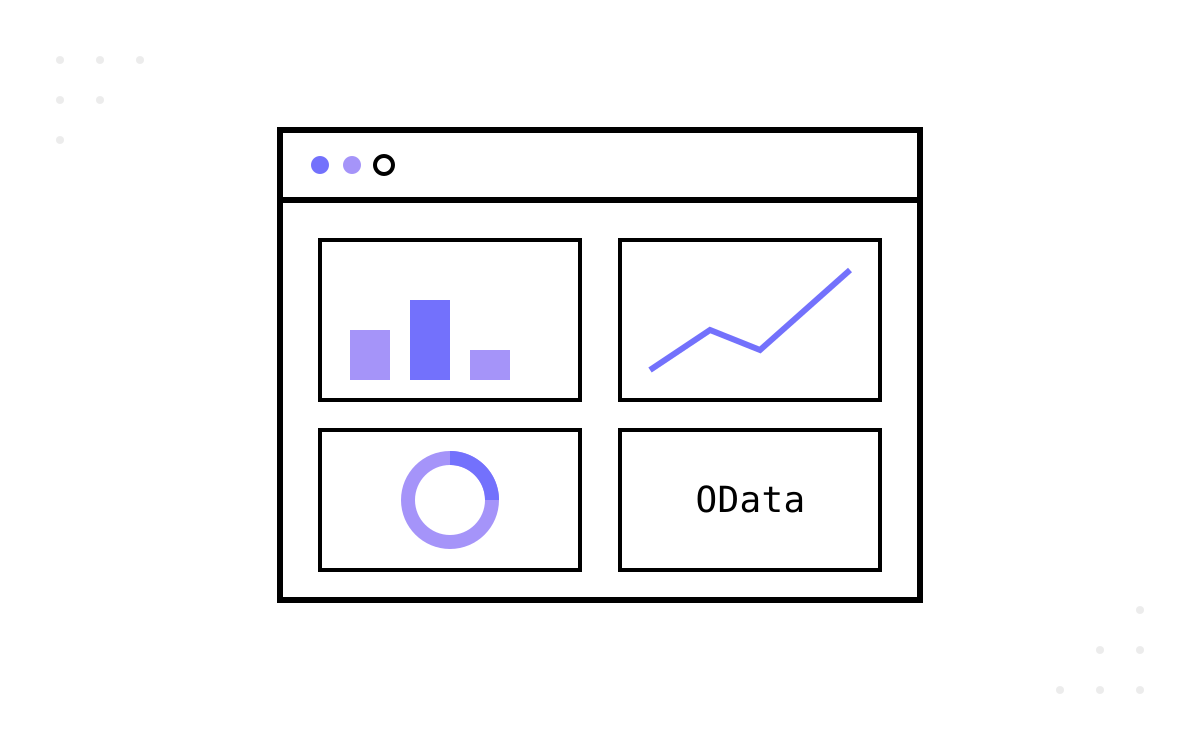
What Azure DevOps will measure for you and where it stops - the two clock definitions, the reactivated-item rule, how to read a cumulative flow diagram, and why Microsoft's own guidance points past its widgets to OData.
Why no single metric captures developer productivity - the SPACE framework's five dimensions in plain terms, the measure-at-least-three rule, and what I do about the two dimensions no dashboard can hold.
The queue mathematics underneath delivery - one equation from 1961, Scaled Agile's six flow metrics rewritten in plain terms, and why the biggest delivery gains hide in the waiting rather than the working.
DORA as it actually stands - five metrics since the 2024 report, benchmarks dated to their vintage, the 2025 archetypes, and the comparison warning printed on the tin.