Observability With Amnesia
Pacco traces every request, scrapes every service every five seconds and ships every log line to Seq - then forgets all of it on docker-compose down, because the telemetry stores are the containers whose volume blocks are commented out. The wiring is exemplary; the memory is the finding.
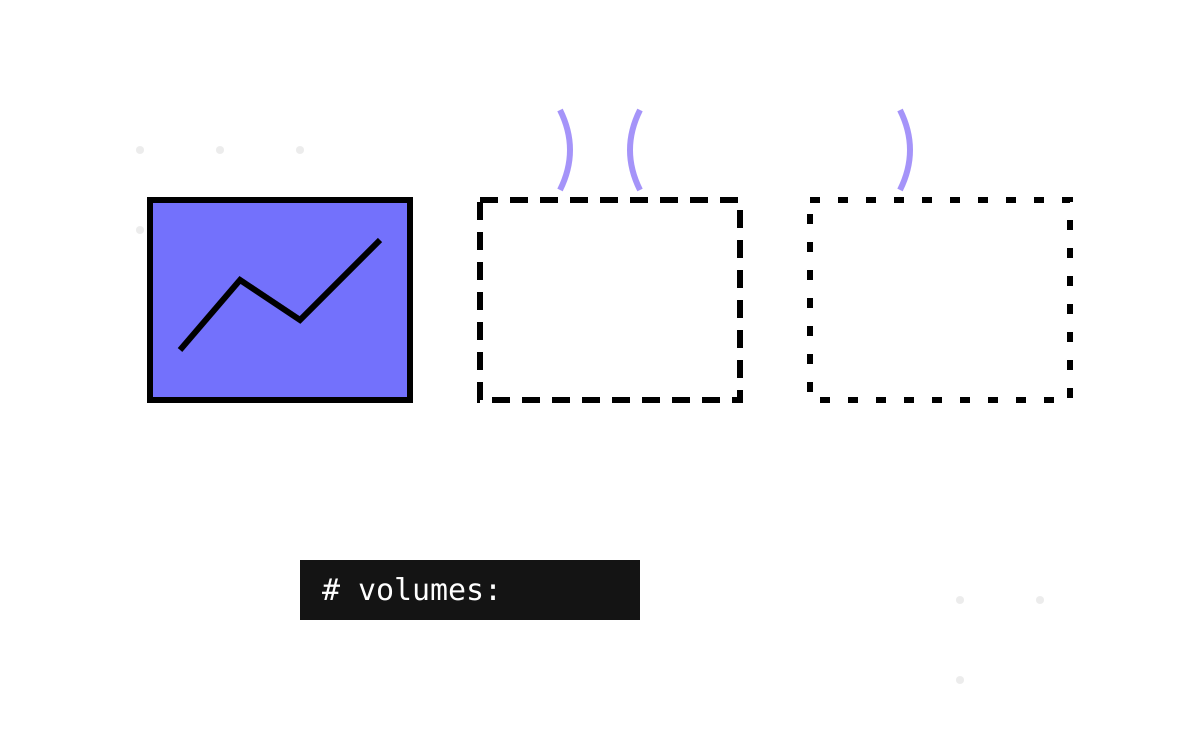
The Pacco estate is one of the most thoroughly instrumented systems I have read, and it cannot remember yesterday. Every request is traced, every service is scraped every five seconds, every log line lands in Seq — and the containers holding all of it run without volumes, so docker-compose down erases the estate's entire operational history. Part 11 read the umbrella repo as the place the estate's runtime truth lives; this part reads its observability wiring — first with the respect the wiring deserves, then with the question the wiring never answers: observability of what period?
The wiring, read with respect
Start with what is genuinely well done. Every service's configuration carries the same three blocks. Tracing:
"jaeger": {
  "enabled": true,
  "serviceName": "orders",
  "udpHost": "jaeger",
  "udpPort": 6831,
  "sampler": "const",
  "excludePaths": ["/", "/ping", "/metrics"]
}
A const sampler means every request is traced — no sampling decisions, no lost causality, the right call for a teaching estate where you want to see each hop. The excludePaths line shows real operational taste: health pings and metric scrapes would otherwise be the loudest traffic in Jaeger, so they are filtered at the source. Metrics are AppMetrics with prometheusEnabled: true, exposing /metrics on every service. Logs go to console, a rolling file, and Seq, with an excludePaths twin keeping the scrape noise out.
The scrape side is equally deliberate. Prometheus is built as a tiny custom image — FROM prom/prometheus plus a COPY of its config — whose prometheus.yml declares a job per application container, eleven of them by compose DNS name, plus itself and RabbitMQ, at a five-second interval. And RabbitMQ itself is a first-class citizen: the umbrella builds it as a custom image too, FROM rabbitmq:management with a one-line enabled_plugins file switching on rabbitmq_prometheus, and the scrape config targets rabbitmq:15692. For a 2020, netcoreapp3.1-era estate, broker metrics via the native Prometheus plugin was current practice, not archaeology. Grafana sits on port 3000 to draw it all. The pipeline — traces to Jaeger, metrics to Prometheus, logs to Seq, dashboards in Grafana — is the full CNCF-adjacent diagram, actually wired, actually flowing.
Two copies of the truth
The first crack is a familiar one from this series: duplication as an environment strategy. There are two prometheus.yml files — compose/prometheus/ for the container-network stack and compose/host-prometheus/ for the network_mode: host variant — hand-synced siblings, like the four Ntrada YAML copies of part 3. They have already drifted in three small ways. The docker copy names its gateway job api-gateway; the host copy names it api — same service, two label vocabularies, so any Grafana panel keyed on the job label works in one universe and shows no data in the other. The docker copy's targets are port-less (Prometheus defaults them to 80, correct inside the network); the host copy enumerates localhost:5000 through localhost:5015. And both files carry the same fossil comment — # Set the scrape interval to every 15 seconds — above a value that says 5s; the comment describes a config that no longer exists, in duplicate. None of these is serious alone. Together they are the drift signature of every hand-synced pair: copies do not diverge dramatically; they diverge one harmless line at a time, and the labels are always first. There is also a structural cost hiding in that COPY: the scrape config is baked into the image at build time, so adding one scrape job means rebuilding the Prometheus image, not editing a mounted file.
The amnesia
Now the finding the title promises. Here is the infrastructure compose file's volume section, in full:
volumes:
  # consul:
  #   driver: local
  # grafana:
  #   driver: local
  mongo:
    driver: local
  # prometheus:
  #   driver: local
  # rabbitmq:
  #   driver: local
  redis:
    driver: local
  # seq:
  #   driver: local
Let me be precise about it, because the folklore version — “Pacco runs volume-less containers” — is not quite true, and the truth is more interesting. Mongo and Redis mount real named volumes, in both the full stack and the minimal mongo-rabbit-redis.yml partial. Your domain data survives a down; so does Redis. What evaporates is everything the observability section just built: Grafana's dashboards (hand-crafted in the UI, because the repo ships no provisioning), Prometheus's time-series database, Seq's logs, RabbitMQ's queues and exchanges — each with its volume block written and commented out, the deliberate-looking artefact of someone who considered persistence and deferred it. Jaeger is the purest expression: the all-in-one image runs with no volume block at all and, unconfigured, stores traces in memory — for that container there was no line to comment out, because a volume would not have helped. Add the per-service logs/logs.txt rolling file, written to each app container's own filesystem, and the pattern is complete: the estate persists its facts and forgets its telemetry — business state is durable, but every trace, metric, log line and dashboard describing how the system behaved is scoped to the current up.
The partial stacks deepen it one notch. Bring up mongo-rabbit-redis.yml instead of the full infrastructure and your broker is stock rabbitmq:3-management — no Prometheus plugin, no port 15692 — so the rabbitmq scrape job points at nothing. The observability guarantees depend on which compose file you typed, which is the umbrella-drift lesson of part 11 wearing operational clothes.
Why it matters, in ascending severity:
- Dashboards are unrepeatable labour. Every Grafana panel anyone builds dies with the container. The estate teaches observability while structurally discouraging investment in it.
- Baselines cannot exist. Five-second scrape resolution with no retention means you can see now in exquisite detail and can never answer “is this normal?” — the question metrics exist for.
- Incidents erase their own evidence. The reflexive responder move — restart the stack — destroys the traces and logs of the failure being investigated. The observability stack is at its least useful at the exact moment it earns its keep.
To be fair to the authors: this is a course estate, the volume lines are one uncomment away, and ephemeral telemetry keeps a student's machine clean across sessions. The commented-out blocks even read as intentional pedagogy — here is where persistence would go. My quarrel is only with how quietly the posture travels: nothing in the README says “this stack has no memory”, and estates copied from samples inherit the silence.
The replica set the outbox admits to
One more line in the same key, because it shows the honesty living elsewhere in the config. That durable Mongo is a single mongo container — one instance, no --replSet, no transactions available. And the services know: every outbox configuration in the estate carries "disableTransactions": true, the messaging reliability pattern openly admitting that its entity-write and outbox-write cannot be atomic on the database as deployed. What that concession does to delivery guarantees is the domain series' story — the outbox with transactions turned off traces it through the handlers. From the platform side, notice the asymmetry instead: the outbox config documents its compromise in a named flag, while the observability stack's equivalent compromise is a comment character. One subsystem states its weakness in its interface; the other hides it in its deployment file. The first can be linted, alerted on, argued with in review. The second is discovered on the morning after the first down.
Memory is part of the pattern
The distilled rule I take from this read: telemetry state is state. Traces, metrics, logs and dashboards are not exhaust; they are a dataset your future self queries, and they deserve the same persistence decision — made explicitly, in review — as the order table. The checklist version:
- Volumes (or remote storage) for every telemetry store, or a written decision saying why not.
- Dashboards as code — provisioned, versioned, reviewable — never only in a container's filesystem.
- One scrape config, parameterised, not N hand-synced copies.
- An honest flag over a quiet omission, always:
disableTransactions: trueis better engineering than a commented-out volume, even when the compromise is identical.
Pacco's observability is a fully-plumbed nervous system attached to no long-term memory — which is fitting, because the estate's naming system is where its long-term memory actually lives: read any queue name and it tells you who subscribes to whom, in a grammar so consistent you can parse the whole estate from RabbitMQ's management UI. That grammar — its nouns, its verbs, and its irregular forms — is next: the grammar of the estate.