One Metric, Three Answers
The same dashboard KPI is computed by three different formulas across role-variant procedures, rendered on a gauge with a sibling metric quietly deleted - and the fact table beneath it is an accidental Kimball star nobody designed.
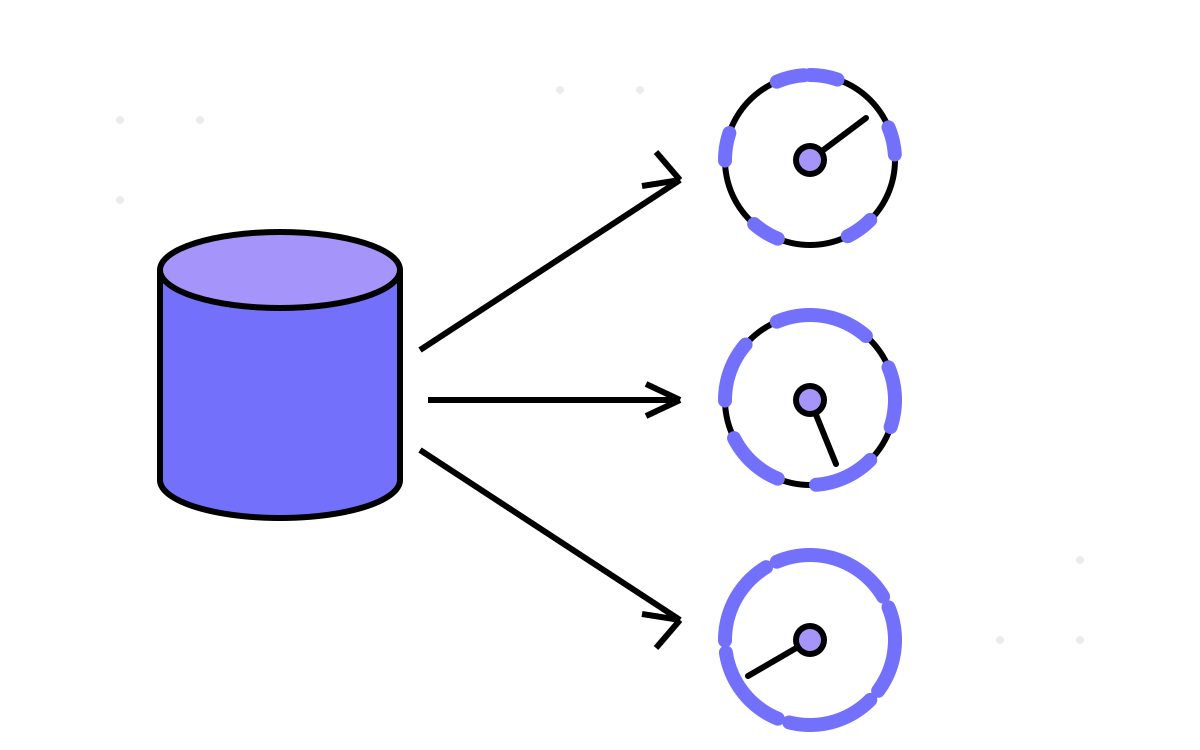
Part 15 left a thread dangling: the procedures that render the platform's dashboards do not agree on how to compute the numbers they render. This part pulls that thread all the way, because it turns out to be the estate's most important data-analytics finding — and it opens onto a second, quieter one. The dashboards are fed by a table that, without anyone intending it, is a textbook Kimball fact table: a dense periodic snapshot, role-playing dimensions, slowly-changing overwrites and all. An accidental data warehouse, read by three procedures that can't agree what “average” means. That combination — rigorous structure underneath, undisciplined semantics on top — is the whole discipline of BI in one estate.
The same tile, three formulas
The dashboards show role-tailored views — an employee sees their own numbers, a manager sees a team, HR sees the org — and each role is served by its own stored procedure: GetMonthOverView, GetMonthOverViewManager, GetMonthOverViewHR, near-verbatim copies in the estate's usual style. Each returns an output parameter the UI labels simply “Average” and prints in the same slot on the same card. Read the three procs and the label is a lie of omission, because the maths behind it differs by role:
Employee variant — a plain arithmetic mean of daily office hours:
SET @AvgOffice = (SELECT AVG(CAST(CAST(OfficeHours AS DATETIME) AS FLOAT))
                  FROM ... WHERE OfficeHours <> '00:00:00');
Manager and HR variants — a five-day-capped weekly-normalised utilisation:
-- per week: worked / (DailyTarget * min(daysPresent, 5)), then averaged over weeks
SUM(minutes) / (DailyTime * IIF(COUNT(...) > 5, 5, COUNT(...))) * DailyTime
These are not two roundings of one number; they are different statistics. The employee's “Average” is central tendency of raw daily hours. The manager's “Average” for the same employee is a bounded utilisation ratio scaled back into an hours-shaped figure, grouped by DATEPART(WEEK, ...), with the five-day cap and moving denominator from part 15 baked in. An employee who checks their own dashboard and then asks their manager why the number differs is not seeing a bug in the usual sense — both procedures run correctly. There is simply no single definition of the metric anywhere in the system. The definition is wherever you happen to be standing in the org chart.
This is the finding I would put on the first slide of any review of this estate, because it is the one that quietly corrodes trust. Nobody screenshots a stack trace of a KPI. They just slowly stop believing the dashboard, because the numbers “don't add up between screens” — and they are right, and no error was ever logged, because none occurred. A metric with no single source of truth fails silently, in the space between two correct queries.
The KPI defined twice, in two languages
The headline gauge — a completion percentage, approved rows over total rows, both filtered — has the opposite problem: too many homes rather than too few. It is defined in SQL, inside GetYearOverView, as approved / total. And it is defined again in C#, as a Percentage property on a view-model that recomputes the same ratio from the same data after the fact. Two implementations of one formula, in two languages, in two layers, kept in agreement by nothing but the discipline of whoever edits them. Change the filter in the proc — exclude a new category of day — and the C# figure drifts from the SQL figure until someone notices they disagree. Duplicated logic across a language boundary is the hardest kind to keep synchronised, because no compiler and no test spans the seam.
The gauge, and the metric that was deleted
The number reaches the user as a circular progress gauge, drawn client-side by a small vector-graphics library — ProgressBar.Circle fed the computed percentage, an arc filling toward 100%. It is a real, if modest, data-visualisation surface, and it is the delivery end of the same numbers the drag-drop report builder and the Excel exports deliver in other channels. (Those two — the self-service builder and the spreadsheet as delivery mechanism — are the web series' territory; I mention them once, as the map allows, because a KPI's channel is part of its design and this estate had three.)
The gauge markup carries a fossil worth exhuming. Directly above the live completion gauge sits a commented-out second gauge — a Productivity KPI — fully built, fully wired, and disabled. A metric that once shared the card was removed from the dashboard not by deletion but by comment, leaving its corpse in the view for the next reader to wonder about. (There is even a commented-out confetti canvas nearby, for the celebration that never shipped.) A dashboard is a set of decisions about what is worth showing, and this one records a reversed decision in its own source: Productivity was worth showing, then it wasn't, and the change was made the way this estate makes every change — by leaving the old thing where it was, inert.
The accidental star schema
Now the structural surprise underneath all of it. Squint at ShiftDetailMonthlyReport with a data-warehouse eye and it is a Kimball periodic-snapshot fact table, complete and correct, that nobody set out to build:
- Grain: one row per employee per calendar day — declared, uniform, and dense, because part 6's gap-fill writes a row for every day including absences. Dense grain is exactly what a snapshot fact table needs so that
AVGandCOUNTdon't skip the zeros. - Measures: office hours, WFH, total hours, productivity — semi-additive durations, the classic snapshot measure type (you sum them across employees, average them across days, never sum them across days into nonsense).
- Role-playing dimensions:
ShiftAllowanceis referenced twice from the fact — once asSuggestedShiftId, once asInputShiftId. That is the textbook definition of a role-playing dimension: one dimension table, two roles — here, predicted shift versus accepted shift.Customerplays the client dimension viaClientId. - Degenerate dimensions:
IsApproved,HasReason,AllocatedAllowance— flags living on the fact with no dimension table of their own. - Type-1 slowly-changing behaviour:
EmployeeNameandManagerIdare denormalised onto the fact and overwritten on every calculator run — Type-1 SCD, which silently discards history. Rename in the HR system and last year's report rows retroactively show the new name, as if it had always been so. For most attributes that is fine; for a manager attribute on an attendance record it means historical rows can attribute a person's past days to their current manager, quietly rewriting who-approved-whom.
The three serving views sitting over this fact — re-aggregating virtual-swipe productivity with correlated subqueries at query time — are a hand-rolled semantic layer, the exact role a BI tool's model would play. So the estate independently reinvented a fair chunk of dimensional modelling: a snapshot fact, conformed and role-playing dimensions, a semantic layer. It did it without the vocabulary, so it also did it without the discipline — no conformed metric definitions, no single source of truth, Type-1 overwrites chosen by default rather than by decision. Good structure and bad governance are separable, and this estate has one without the other.
The training set nobody trains on
One last observation closes the data lens, and it reaches back to part 5's shift inference. Every fact row stores, side by side, the machine's prediction (SuggestedShiftId) and the human's accepted label (InputShiftId, IsApproved, ModifiedBy). Prediction beside ground truth, on millions of rows, accumulating for years. That is, structurally, a labelled training set with a built-in feedback loop — precisely the raw material you would feed a model to learn better shift inference, or to flag the cases where the rules reliably disagree with humans.
Nothing consumes it. There is no model, no retraining, no drift monitoring, no analysis of where suggestion and acceptance part ways. The inference stays fixed rules and fixed per-client thresholds forever, while the data that could improve it piles up unread. The data-science verdict on this estate is, fittingly, an absence — no learning anywhere — but it is the most tantalising absence in the series, because the dataset to end it was being carefully assembled the whole time, one approved row at a time, by a system that never noticed what it had.
From the numbers, we step back to the machinery that ships them: the pipelines. And they have a secret — they test nothing, they distribute code through a folder of committed binaries, and one executable in the estate has no pipeline at all. Next, CI theatre and a NuGet feed made of folders.