Rollups at Every Altitude
KC Star V5 climbs the org chart in a single view - employee to office to region to organisation - and a stored procedure that materialises the rollups. Commission analysis and quote-to-delivery ratios fall out of the same hierarchy.
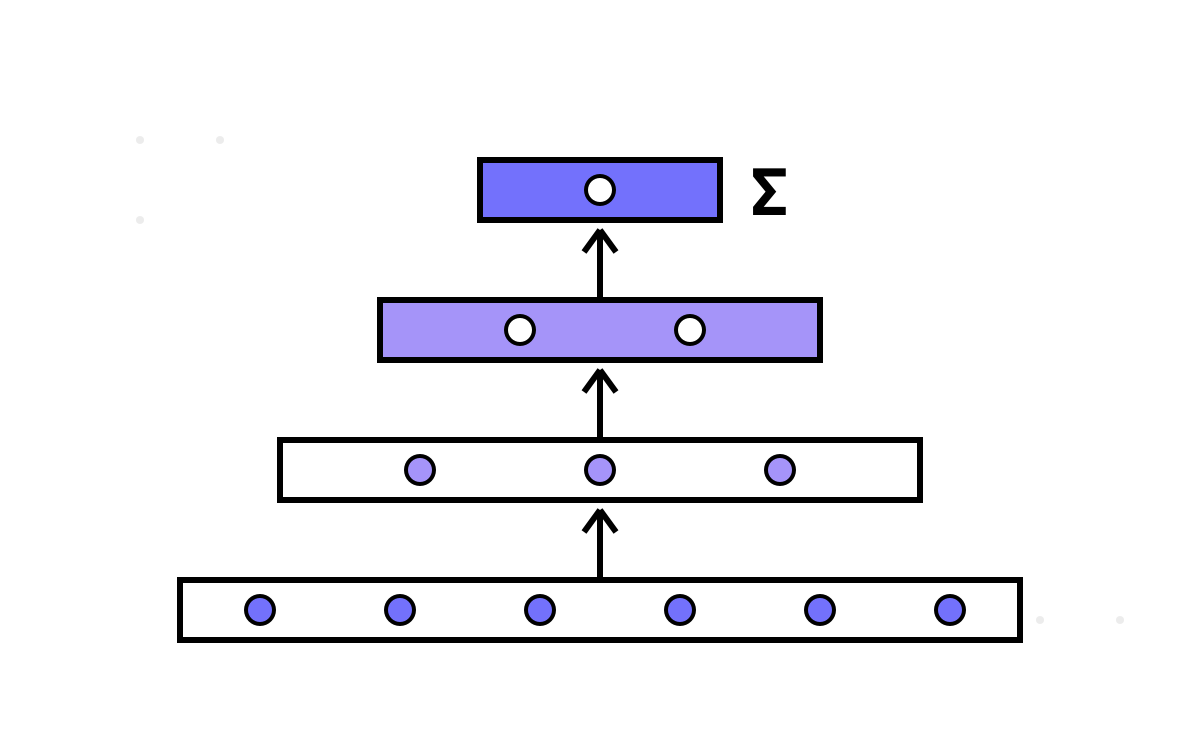
The bridge table connects a sale to a spot in the org chart. This post is about what you do once every sale knows its place: climb. V5's payoff is rollups at every altitude — the same numbers summarised at employee, office, region and organisation level — delivered through a view that walks the whole hierarchy and a procedure that materialises the results. Commission analysis and quote-to-delivery ratios come along for free, because they are just rollups with different measures.
The hierarchy in one view
The base org tables from part 1 form a four-level chain: Organisation owns Regions, regions contain Offices, offices employ Personnel. The most direct way to see the whole structure is a view that joins the chain top to bottom:
CREATE OR REPLACE VIEW OrgHierarchy AS
SELECT o.OrgId, o.Name AS OrgName,
       r.RegionId, r.Name AS RegionName,
       off.OfficeId, off.Name AS OfficeName,
       p.EmployeeId, CONCAT(p.FirstName, ' ', p.LastName) AS EmployeeName
FROM Organisation o
JOIN Regions r     ON o.OrgId = r.OrgId
JOIN Offices off   ON r.RegionId = off.RegionId
JOIN Personnel p   ON off.OfficeId = p.OfficeId;
One row per employee, carrying every ancestor's name and id. That view is the skeleton; the rollups hang flesh on it by aggregating measures at each level of the bones.
MultiLevelRollup: one query, four altitudes
The headline object is MultiLevelRollup, a view that computes the same measures at all four levels and stacks them into one result, tagged by which level each row describes:
SELECT Level, LevelId, LevelName,
       ROUND(TotalSales, 2) AS TotalSales,
       SaleCount,
       ROUND(AvgSaleValue, 2) AS AvgSaleValue
FROM MultiLevelRollup
ORDER BY CASE Level
    WHEN 'Organization' THEN 1
    WHEN 'Region'       THEN 2
    WHEN 'Office'       THEN 3
    WHEN 'Employee'     THEN 4
END, LevelId;
The Level column is what makes this work: a single result set holds the organisation's totals, each region's, each office's and each employee's, and the CASE in the ORDER BY arranges them top-down so the output reads like the org chart itself. Ask for total sales and you get the company number, then it decomposed by region, then by office, then by person — the same measure at four resolutions, in one scan. That is the analytical shape executives actually want: not “sales by employee” or “sales by region,” but the whole cascade at once, so you can see where a regional total comes from without running four separate queries.
Materialising the rollups
The view computes rollups on read. For heavier use, V5 also ships CreateOrganizationalRollups, a procedure that materialises them into the org star's fact rows:
CALL CreateOrganizationalRollups(1); -- roll up for OrgId 1
This walks the hierarchy for a given organisation and writes the level-by-level aggregates into OrgFact as proper, SCD2-versioned facts — the same inversion the sales side uses, applied to organizational measures. Once materialised, a rollup is a stored fact with history: you can time-travel an office's total the same way you time-travel a sale's discount, and the rollup carries its quality score and version hash like any other fact. The view is for ad-hoc questions; the procedure is for rollups you want to keep, track and trust over time.
Commissions are just a rollup
Here is the part I like: once you have the hierarchy and the rollup machinery, questions that sound like separate features turn out to be the same feature with different measures. Commission analysis is a rollup of CommissionEarned from EmployeeSales:
SELECT p.EmployeeId, CONCAT(p.FirstName, ' ', p.LastName) AS Employee,
       SUM(es.CommissionEarned) AS TotalCommission,
       SUM(es.DeliveredAmount)  AS TotalDelivered
FROM EmployeeSales es
JOIN Personnel p ON es.EmployeeId = p.EmployeeId
GROUP BY p.EmployeeId, p.FirstName, p.LastName
ORDER BY TotalCommission DESC;
And quote-to-delivery — how much of what an employee quoted actually converted to delivered revenue — is a rollup of a ratio:
SELECT p.EmployeeId,
       SUM(es.QuoteAmount)     AS TotalQuoted,
       SUM(es.DeliveredAmount) AS TotalDelivered,
       ROUND(SUM(es.DeliveredAmount) / NULLIF(SUM(es.QuoteAmount), 0), 3) AS ConversionRatio
FROM EmployeeSales es
JOIN Personnel p ON es.EmployeeId = p.EmployeeId
GROUP BY p.EmployeeId;
Neither of these needed new machinery. They are the org star's 14 organizational measures — TotalQuotes, TotalDelivered, TotalCommission, QuoteToDeliveryRatio and the rest — surfaced through the same rollup pattern. The NULLIF guards the division, but otherwise this is exactly the shape of every other rollup in the version. Build the hierarchy and the rollup engine once, and each new “analysis” is a measure swap.
Why rollups are the point of a hierarchy
A hierarchy that you cannot roll up is just an org chart in table form — pretty, and useless for analytics. The value is entirely in the aggregation: being able to take a per-sale or per-employee number and see it summarised at whatever altitude the question is asked. MultiLevelRollup and CreateOrganizationalRollups are the two halves of that — read-time flexibility and write-time permanence — and between them they turn the org hierarchy from structure into insight.
There is a wrinkle I have been quietly stepping around. Everything in this post describes how the folder build of V5 does rollups — via SCD2 facts and these views. The root build of V5 does something materially different, with real-time triggers and an entirely separate analytical star. Same version number, two implementations that do not contain the same objects. That divergence is big enough to deserve its own honest accounting, and it gets one next: one version, two implementations.