The Observability Stack of 2018
DShop wires Serilog, App.Metrics and Jaeger through one shared kernel, propagates a trace span on the message envelope, and hangs its Consul health check on an endpoint no controller defines. A tour of pre-OpenTelemetry observability.
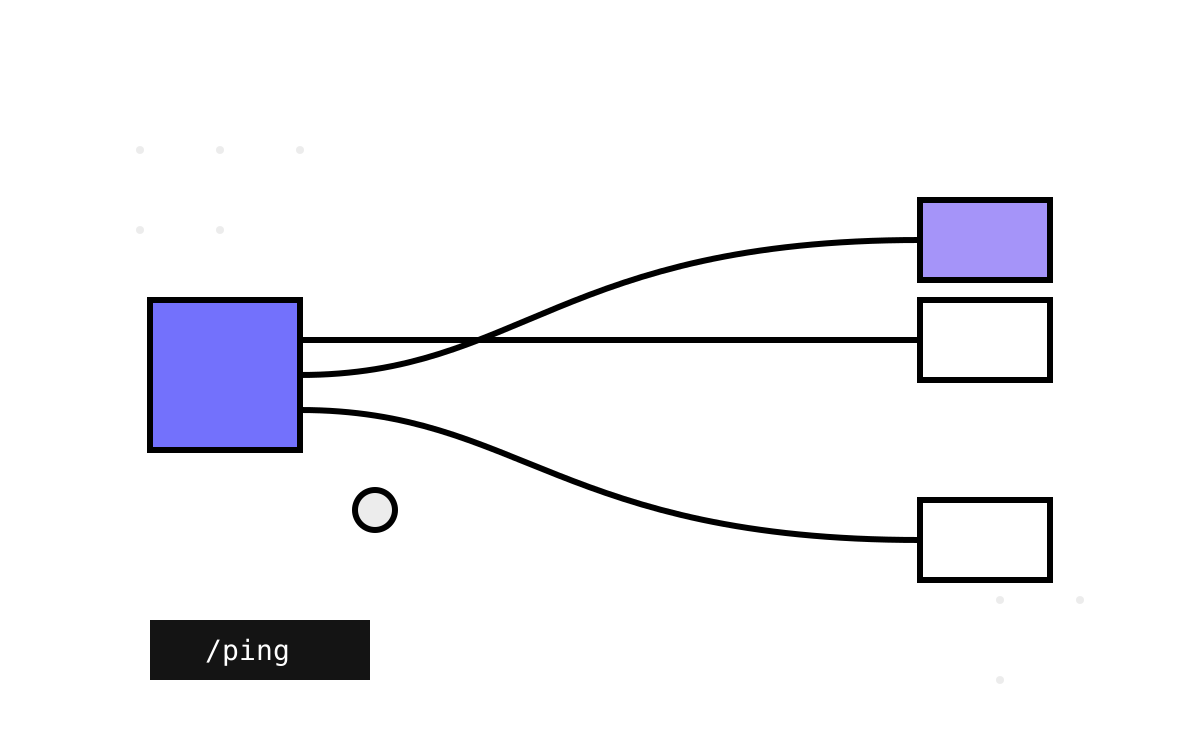
Observability in 2018 was assembled, not bought. There was no OpenTelemetry, no single SDK that gave you logs, metrics and traces through one export pipeline. You picked a logging library, a metrics library, a tracing library, and you wired all three into every service by hand. DShop did exactly that, and because it did it through the shared kernel, the wiring is uniform enough to read as a single design. This part reads the three signals — and the one clever, fragile decision that ties the estate's health to an endpoint no controller defines.
Three signals, one boot line
Every service turns on its observability in the host builder. The gateway's Program.cs is the template:
WebHost.CreateDefaultBuilder(args)
    .UseStartup<Startup>()
    .UseLogging()      // Serilog -> console / Seq / ELK
    .UseVault()
    .UseLockbox()
    .UseAppMetrics();  // App.Metrics -> InfluxDB / Prometheus
UseLogging wires Serilog with three sinks, gated by config: a console sink, a Seq sink (http://localhost:5341), and an ELK Elasticsearch sink with a per-day index format api-{0:yyyy.MM.dd}. UseAppMetrics wires App.Metrics, which can export to InfluxDB (for Grafana) or expose a Prometheus scrape endpoint. And Startup adds Jaeger for distributed tracing. Three vendors, three signals, all switched on and off by boolean flags in appsettings.json — the Enabled-flag convention the shared kernel uses everywhere. The whole observability posture of a service is legible in one config file, which is genuinely more than many modern services can say.
The span that rides the message
The interesting decision is in tracing, and it is the one that makes traces span service boundaries. Jaeger is configured over UDP to port 6831 with a const sampler — sample everything, fire-and-forget over UDP so the app never blocks on the tracer. Auto-instrumentation (OpenTracing.Contrib) captures the inbound HTTP span for free. The clever part is what happens at a write, where the request leaves HTTP and becomes a message on the bus. HTTP trace headers cannot cross RabbitMQ — so the gateway serialises the active span's context into the correlation envelope:
return CorrelationContext.Create<T>(Guid.NewGuid(), UserId, resourceId ?? Guid.Empty,
    HttpContext.TraceIdentifier, HttpContext.Connection.Id,
    _tracer.ActiveSpan.Context.ToString(),   // the Jaeger span, serialised onto the message
    Request.Path.ToString(), Culture, resource);
The span context travels with the command as a field on the CorrelationContext, so the downstream service that handles the message off the queue can resume the same trace — a single Jaeger timeline stretching from an HTTP POST /orders at the gateway, across the bus, through the Operations saga, to the Orders and Products services. This is trace-context propagation over a message transport, hand-built before W3C Trace Context was a standard, and it is the right instinct: a correlation id tells you which logs belong together; a propagated span tells you how long each hop took. DShop carries both on the same envelope.
There is a sharp edge here that Series 1 reads in the framework: the tracing middleware wraps handler execution, and in doing so it can swallow the very exception it was meant to observe — a wire tap that cuts the wire. The instrumentation is good; its interaction with error handling is one of the places reading the source changes how much you trust it.
The health endpoint that isn't there
Now the fragile decision. Consul health-checks each service by polling an HTTP endpoint, and the config names it:
"consul": {
  "pingEnabled": false,
  "pingEndpoint": "ping",
  "pingInterval": 5,
  "removeAfterInterval": 10
}
Consul will hit /ping every few seconds and deregister the service if it fails for removeAfterInterval. So where is /ping defined? Grep the entire gateway for “ping” or “health” and there is nothing — no PingController, no MapHealthChecks, not a single reference. The only controller near the root is HomeController, which serves GET / returning "DShop API". The /ping endpoint Consul depends on is not in the application's code at all.
It is served by the App.Metrics middleware — the same .UseAppMetrics() that wires the metrics pipeline also mounts a /ping liveness endpoint. And that is the trap: the health check and the metrics system are the same component, so turning off metrics turns off health. Set metrics.enabled to false — a change any reasonable operator might make to reduce noise, thinking it purely a telemetry decision — and /ping vanishes. Consul's health check starts returning 404, the service is marked unhealthy, and after removeAfterInterval it is silently deregistered and drops out of routing. Nothing in the config file connects “metrics” to “health”; the dependency lives only in the fact that one middleware happens to provide both endpoints. An operator disabling metrics would have no reason to expect the service to disappear, and every reason to be confused when it does.
The honest ledger
To be fair to the stack: for 2018 this is a strong observability story. Structured logs to Seq or ELK, dimensional metrics to Influx or Prometheus, sampled traces to Jaeger with cross-transport propagation — assembled uniformly across every service through the shared kernel, and all toggleable by config. Plenty of production systems a decade later have less. The span-on-the-envelope trick in particular is the kind of thing you only appreciate once you've tried to debug a distributed write with disconnected traces on either side of a queue.
But the ledger has real entries:
- Three vendors, three pipelines, no unified export. This is exactly the fragmentation OpenTelemetry later existed to end — and it means three sets of credentials, three sinks, three failure modes to operate.
- The invisible
/ping. Coupling liveness to the metrics middleware is a footgun: the endpoint that keeps a service in the registry is provided by a subsystem an operator thinks is optional. A health check should be defined where a reader can find it, not inherited from a telemetry package. - Fire-and-forget UDP tracing drops spans silently under load — fine for a teaching estate, a blind spot in production, and invisible because dropped spans don't error, they just don't arrive.
The rule of thumb: a health check you can't find in the code is a health check you don't control. DShop's /ping works until someone changes a setting they had no reason to associate with it — and that gap, between what a config key appears to control and what it actually controls, is where the estate's operability quietly leaks. Next, the whole map, drawn once and read honestly: cartography of an estate.