Tracing a Message Through the Chassis
How Convey stitched one Jaeger trace across HTTP, a command handler and a RabbitMQ hop years before OpenTelemetry - and the six-line catch block in its tracing plugin that can silently eat your failures.
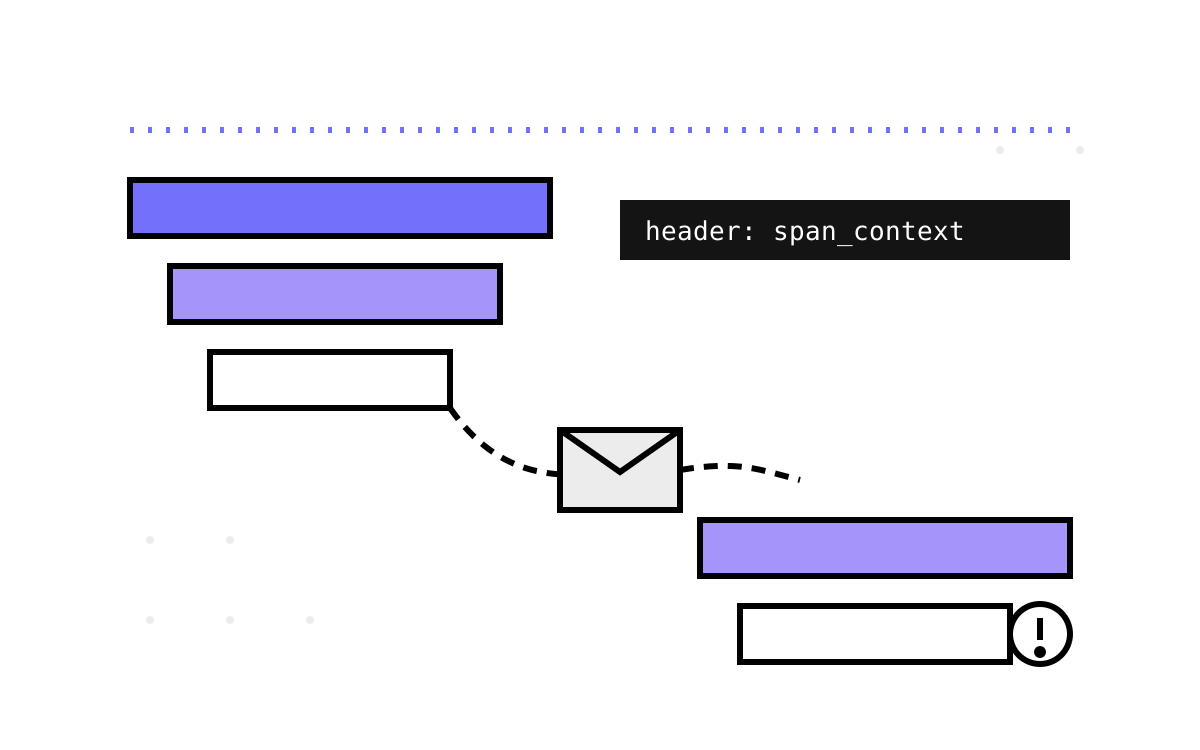
The hardest question in a microservices incident is not “what failed?” — your alerts told you that. It is “what was this request doing when it failed, three services and one message broker ago?” Logs answer it eventually, if part 19's correlation discipline held and you are patient with queries. Distributed tracing answers it as a picture: one trace, spans nested under spans, the broker hop drawn as a gap you can measure.
Convey.Tracing.Jaeger and its companion Convey.Tracing.Jaeger.RabbitMQ — from DevMentors' open-source toolkit — built that picture for .NET services years before OpenTelemetry made it standard equipment. I am going to walk one request through the whole apparatus, because the propagation mechanics are still exactly how tracing works under today's abstractions. And then I am going to show you six lines from the plugin that I consider the most instructive defect in the entire toolkit. Fair warning given up front: OpenTracing is archived and the Jaeger C# client is deprecated — this part is deliberate archaeology, with a working lesson at the end of it.
Building the tracer
AddJaeger() binds the jaeger section and assembles a tracer from it:
"jaeger": {
  "enabled": true,
  "serviceName": "orders",
  "udpHost": "localhost",
  "udpPort": 6831,
  "sampler": "const",
  "excludePaths": [ "/ping", "/metrics" ]
}
Spans ship over UDP to a local Jaeger agent (an HTTP sender is available for agentless setups), auto-instrumentation of ASP.NET Core comes via OpenTracing.Contrib.NetCore, and excludePaths keeps the pollers from parts 15 and 20 out of your trace storage. The finished tracer is registered in DI and pushed into OpenTracing's process-wide singleton:
// Convey.Tracing.Jaeger/Extensions.cs
var tracer = new Tracer.Builder(options.ServiceName)
    .WithReporter(reporter)
    .WithSampler(sampler)
    .Build();

GlobalTracer.Register(tracer);
GlobalTracer.Register throws on a second call — hence the package's belt-and-braces guards (an Interlocked flag plus the builder's TryRegister from part 2). Process-wide singletons for cross-cutting context is a pattern .NET later blessed as Activity.Current; the friction here is the same friction, one generation earlier.
Three source details worth your attention. When tracing is disabled, the package registers a no-op tracer (NoopReporter + ConstSampler(false)) instead of nothing — so ITracer always resolves and no consumer needs a null check; cheap insurance worth copying. The sampler choice is config: const (everything), rate (n traces/second), probabilistic (a fraction) — and the default is ConstSampler(true), meaning 100% sampling unless you say otherwise; splendid in dev, a storage bill and overhead tax at production volume. And UseJaeger() — present in every sample's pipeline — is a no-op: it resolves options, does nothing, and returns; the real wiring happened at AddJaeger(). Ceremonial API surface that suggests function it does not have deserves deletion.
The hop: a span context rides a header
Inside one process, spans nest through the ambient scope manager and no propagation is needed. The interesting engineering is the broker hop, and it takes both packages cooperating.
On the publishing side, part 12's outbox sample already showed the move — the handler captures the active span's address:
var spanContext = _tracer.ActiveSpan?.Context.ToString();
await _outbox.SendAsync(@event, spanContext: spanContext);
and part 9's publisher stamps it into the AMQP headers under spanContextHeader (default span_context). A Jaeger span context serializes to a compact string — trace id, span id, flags — so the trace's address travels inside the message, exactly as W3C traceparent does in an HTTP header today.
On the consuming side, the JaegerPlugin — slotted into part 10's plugin chain via .AddRabbitMq(plugins: p => p.AddJaegerRabbitMqPlugin()) — reads the header back and resumes the story:
// Convey.Tracing.Jaeger.RabbitMQ/Plugins/JaegerPlugin.cs
var spanContext = SpanContext.ContextFromString(serializedSpanContext);
return spanBuilder
    .AddReference(References.FollowsFrom, spanContext)
    .StartActive(true);
Note the reference type: FollowsFrom, not ChildOf. A child span implies the parent waited for it; a follows-from span says “caused by, but the causer moved on” — precisely the semantics of fire-and-forget messaging. The Jaeger UI draws it as a linked continuation rather than a nested wait. Small vocabulary choice, correct distributed-systems statement; whoever wrote this line understood what a broker is.
The result, for one CreateOrder request in the sample system: an HTTP span in Orders, the handler's work beneath it, a follows-from link across the RabbitMQ gap, and the Deliveries handler's span on the far side — one trace id, one picture, the broker's latency visible as the space between spans.
The six lines
Now the plugin's delivery wrapper, in full:
try
{
    await Next(message, correlationContext, args);
}
catch (Exception ex)
{
    span.SetTag(Tags.Error, true);
    span.Log(ex.Message);
}
Read it as a tracing author: handler failed, tag the span as errored, log the message onto the span. Reasonable. Now read it as the reliability author of part 10, who is sitting one layer above this plugin in the middleware chain, waiting for exceptions in order to run retries, exception-to-message mapping and dead-lettering.
The exception is not rethrown.
With this plugin installed, no handler exception ever reaches TryHandleAsync's machinery. The retry policy sees success. The exception mappers never run. The dead-letter queue stays empty. The message is acked — because from where the ack logic sits, the handler returned normally. Your reward is a red span in a Jaeger UI nobody is watching, standing in for the compensating events, parked messages and alerts you designed. An observability add-on quietly repealed the failure semantics of the messaging layer it was observing. And the failure mode is invisible by construction: things look calmer with the plugin on, because errors stop happening. They stopped being reported.
The fix is one line (throw; at the end of the catch), but the lesson is the durable part, and it generalizes to every pipeline you will ever assemble: middleware composes semantics, not just behavior. Anything that wraps a handler inherits responsibility for the contract of everything above it — and observing code must never alter the outcome of the code it observes. Tag, log, rethrow. When I review pipeline middleware now — OTel processors, MassTransit filters, ASP.NET Core middleware — the catch blocks are the first thing I read, because of this exact class of bug. Part 20 found the same sin in a different costume (a metrics package flipping a global I/O setting); instrumentation overreach is a genre.
Archaeology's verdict
Everything this pair of packages does has a modern name: GlobalTracer became Activity.Current; the span-context string became W3C traceparent; FollowsFrom became span links; the contrib auto-instrumentation became OpenTelemetry's; the UDP agent became the OTLP endpoint. If you are building today, AddOpenTelemetry() with the ASP.NET Core and RabbitMQ instrumentation packages replaces both of these wholesale, and the retrospective next week says more about that.
But the mechanics you just watched — capture the ambient context, serialize its address into the message, resume with the correct causal reference on the far side — are identical under the new names. Convey's version is small enough to read in an afternoon and wrong in exactly one instructive place, which makes it a better classroom than the production-grade libraries that got it right invisibly.
That closes the observability leg, and with it the package tour: composition, CQRS, HTTP, messaging, persistence, discovery, secrets, security, logs, metrics, traces. Next week is the finale — what Convey got right, what modern .NET ate, and what I would still build a chassis for in 2026.