Metrics Two Ways: AppMetrics and Prometheus
Convey ships two metrics packages that answer the same question from different eras - a push-flavored App.Metrics stack and a lean prometheus-net scrape endpoint - and the choice between them is a history lesson.
Open Convey's source tree and you find something odd: two packages for the same job. Convey.Metrics.AppMetrics and Convey.Metrics.Prometheus both exist, both are maintained parts of the toolkit, and both end in a /metrics endpoint. Redundancy like that is never an accident — it is stratigraphy. One package is a fossil of the push era of .NET metrics; the other is what everyone converged on. Reading both (this is DevMentors' open-source toolkit; I'm reading, not authoring) is a compressed history of how the industry decided monitoring should work — and the samples quietly tell you the ending: every one of them calls AddPrometheus().
The push era: App.Metrics and InfluxDB
AddMetrics() binds the metrics section:
"metrics": {
  "enabled": true,
  "influxEnabled": false,
  "prometheusEnabled": true,
  "influxUrl": "http://localhost:8086",
  "database": "metrics",
  "interval": 5,
  "tags": { "app": "orders", "env": "local" }
}
App.Metrics is a full in-process metrics framework: typed counters, gauges, timers, histograms, apdex; global tags (app/env/server, plus instance and version pulled from AppOptions — the same identity contract the logger used in part 19); its own health endpoints; request-tracking middleware registered through a stack of startup filters. Reporting is push-based: with influxEnabled, a hosted reporter flushes to InfluxDB every interval seconds — the classic 2017 TICK-stack topology where services push and Grafana reads Influx. And because standards were already shifting under it, the package also exposes a Prometheus-formatted endpoint via App.Metrics' own text/protobuf formatters — push architecture, wearing a scrape-era hat.
Two source details are worth the visit. First, an honest comment:
// Convey.Metrics.AppMetrics/Extensions.cs
//TODO: Remove once fixed https://github.com/AppMetrics/AppMetrics/issues/396
builder.Services.Configure<KestrelServerOptions>(o => o.AllowSynchronousIO = true);
builder.Services.Configure<IISServerOptions>(o => o.AllowSynchronousIO = true);
To make the metrics endpoint work, the package re-enables synchronous I/O for the whole host — the setting .NET disabled by default because sync-over-async I/O under load is a thread-pool starvation machine. One observability library, one global regression, documented in a TODO that outlived the library's active development. It is the same lesson part 10 taught with the Jaeger plugin: instrumentation that changes the runtime behavior of the thing it observes has exceeded its mandate.
Second, AddMetrics builds a throwaway ServiceProvider mid-registration and guards initialization with a static _initialized flag and the builder's TryRegister — the toolkit's recurring patterns (parts 2 and 15) making their metrics cameo.
The scrape era: prometheus-net
Convey.Metrics.Prometheus is a fraction of the size, because it outsources the model to Prometheus itself:
services.AddConvey()
    .AddPrometheus()
    .Build();

app.UsePrometheus();
with a section to match its ambitions:
"prometheus": { "enabled": true, "endpoint": "/metrics" }
UsePrometheus() chains UseHttpMetrics().UseGrpcMetrics().UseMetricServer(endpoint) from prometheus-net, and a hosted PrometheusJob starts the .NET runtime collectors:
// Convey.Metrics.Prometheus/Internals/PrometheusJob.cs
_collector = DotNetRuntimeStatsBuilder
    .Customize()
    .WithContentionStats()
    .WithJitStats()
    .WithThreadPoolStats()
    .WithThreadPoolStats()   // yes, twice
    .WithGcStats()
    .WithExceptionStats()
    .StartCollecting();
(The duplicated WithThreadPoolStats() is harmless and eternal — nobody ever reads working code, which is why this series exists.) Out of the box you get HTTP request rates/durations/status codes, GC pauses, thread-pool queue lengths, lock contention, JIT time and exception counts — which is, in my experience, 80% of what you page on, for zero instrumentation effort. Business metrics are plain prometheus-net statics (Metrics.CreateCounter(...)) anywhere in your code; the package deliberately adds no abstraction over them, and that restraint is a feature. Metrics APIs age badly; the exposition format is the real contract.
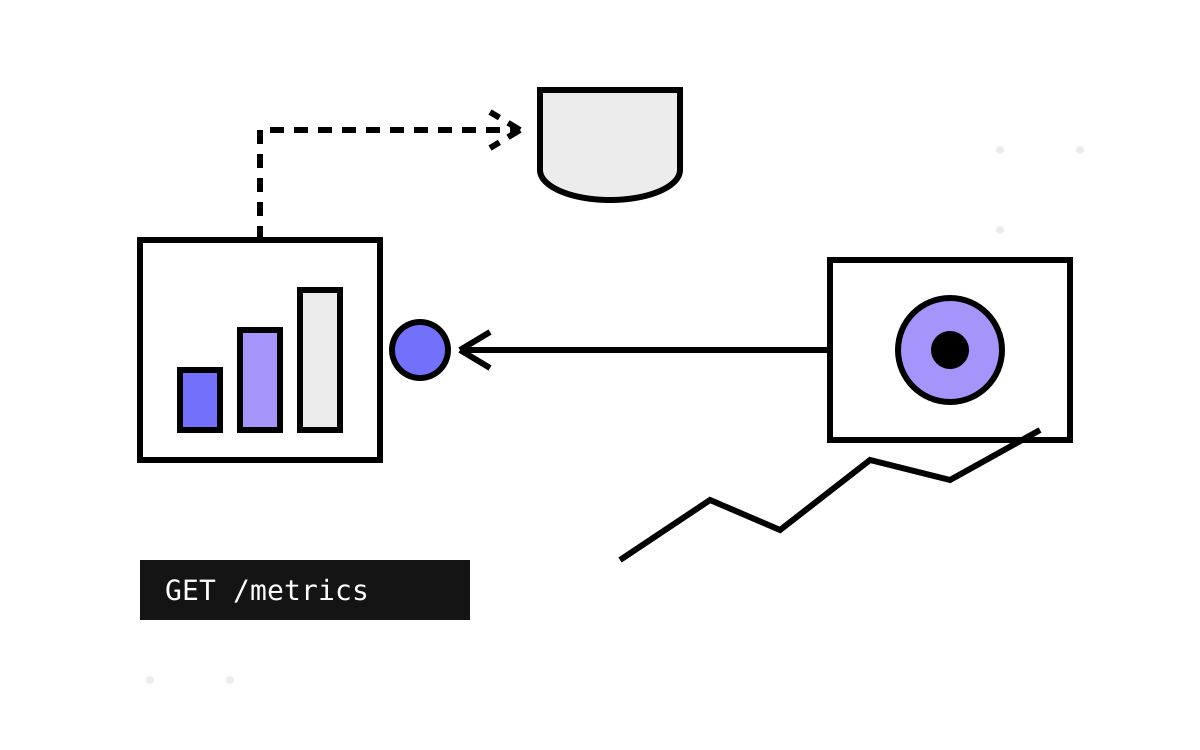
The architectural inversion is the point: nothing pushes. Prometheus scrapes /metrics on its schedule; a down service is a failed scrape, which is itself the up signal — the monitoring system observing absence instead of inferring it from silence. That inversion, more than any feature, is why the scrape model won and why this thin package aged better than its heavyweight sibling.
One wart to check before exposing the endpoint: the guard middleware. An optional apiKey protects /metrics — as a query-string parameter, compared with == (non-constant-time, and destined for every access log along the path), and an allowedHosts list is matched against Host or the raw x-forwarded-for header. That is the third appearance of the forgeable-header pattern in this toolkit (parts 18 and 15 had the others), and by now you know the rule: a client-suppliable header must never gate access. Denied requests get a 404 rather than a 401/403 — defensible as endpoint-hiding, confusing at 2am. In practice the honest posture is simpler: keep /metrics off the public edge entirely and let network policy do the guarding.
Choosing, then and now
Within the toolkit the choice is easy, and the samples already made it: AddPrometheus(), and let the exclusion lists from parts 19 and 21 keep the scrape traffic out of your logs and traces. App.Metrics earns its keep only if you are genuinely wedded to an InfluxDB estate or want its richer in-process types (apdex, precise histograms) badly enough to accept a dormant dependency and the sync-I/O tax.
The 2026 answer sits one layer further on, and it is the retrospective's theme (part 22) in miniature: System.Diagnostics.Metrics — the platform's own Meter/Instrument API — with OpenTelemetry exporting to whatever backend, Prometheus included. The instrument-your-code-once, choose-your-backend-later promise that App.Metrics made in 2017 was the right promise; it just eventually got kept by the platform instead of a library. Convey's two metrics packages bracket that story neatly: one is the promise, the other is the pragmatic interim, and the platform is the punchline.
What survives from both packages as durable practice: tag every metric with the same service identity your logs carry, so dashboards and log queries join on the same keys; collect runtime internals (GC, thread pool, contention) from day one, because you cannot retrofit the baseline you needed during last week's incident; and treat the metrics endpoint as an internal surface with network-level protection, not a query-string password.
Logs, metrics — one leg remains. Next part follows a single request from an HTTP edge through RabbitMQ into a second service, and watches Jaeger stitch it into one trace: the distributed-tracing story, including the plugin that taught me to read observability code first.