The Compose File Is the Architecture Diagram
Three toy services, ten infrastructure containers. Reading Convey's docker-compose stack as the honest bill of the chassis: what each container is for, which volumes actually persist, the per-OS variants, and what I would cut in 2026.
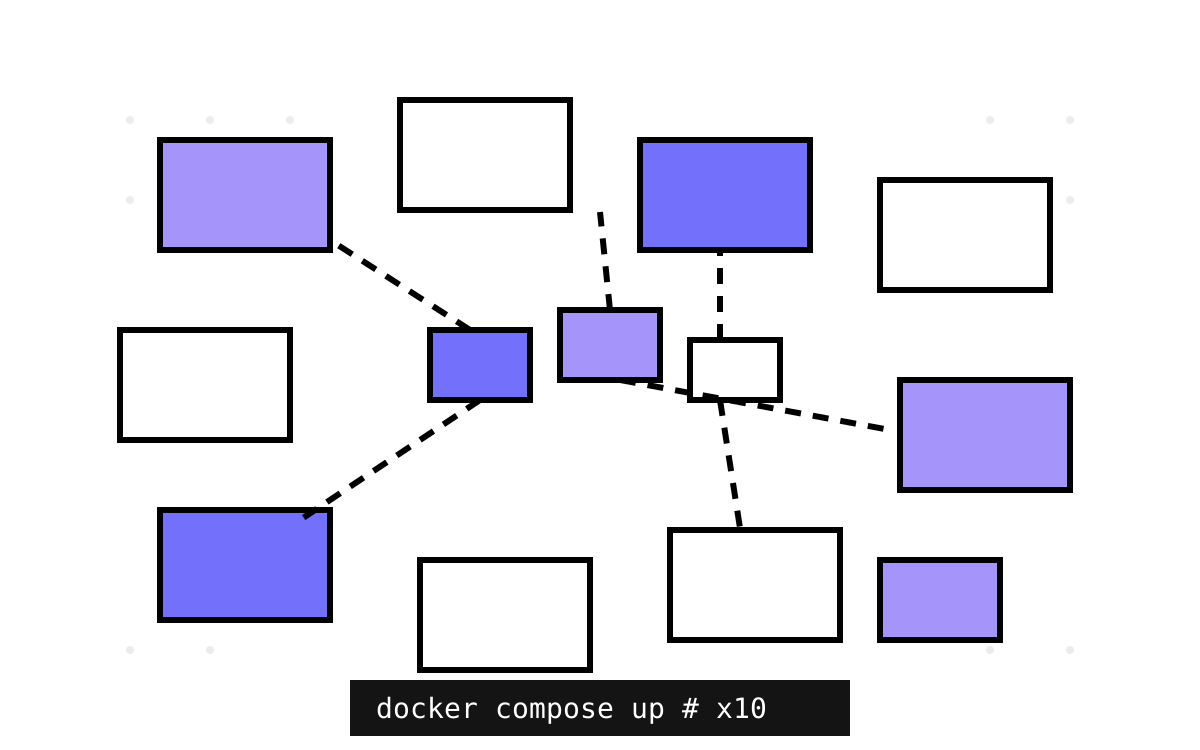
Twenty-two parts into reading Convey's source, I had never once written about the file you have to run before any of it works. The samples/compose/ folder holds the docker-compose stack that backs the Conveyor sample from chapter one, and it deserves a chapter for a blunt reason: it is the most honest architecture document in the repository. Program.cs tells you what a service can do. The compose file tells you what the system costs.
The headline number: to run three toy services that collectively hold one aggregate and two events, the stack stands up ten infrastructure containers — consul, fabio, grafana, jaeger, mongo, prometheus, rabbitmq, redis, seq, and vault. The ratio is 10:3, infrastructure to application, and every one of those ten earns its place by some Add* call the parent series covered. That ratio is not a Convey problem. It is the microservices problem, rendered in YAML, and reading the file line by line is the cheapest operations education the repo offers.
Roll call, by what breaks without it
Group the ten by the failure you get when they're missing and the file organizes itself:
The system stops working: mongo (Orders' state), rabbitmq (every OrderCreated/DeliveryStarted hop, with the management UI on 15672 — the single most useful debugging surface in the stack), redis (Deliveries' registration and the distributed-cache seam from part 13).
The system works but you can't see it: seq for structured logs (part 19), jaeger all-in-one for traces (part 21) — count its ports: seven of them, UDP agent, collector, query UI, zipkin-compat, a whole distributed system folded into one dev container — prometheus for metrics (part 20), and grafana, which ships completely unconfigured: no provisioned datasource, no dashboards, port 3000 and a login page. It is a suggestion, and an accurate one: dashboards were always going to be your job.
The system works, differently: consul and fabio (part 15) — both enabled: false in every sample's config, so the pair idles unless you flip the flags; the compose file provisions the optional future too. And vault, which runs in dev mode with VAULT_DEV_ROOT_TOKEN_ID=secret and IPC_LOCK capability — an in-memory Vault whose root token is the word “secret”, perfect for exercising the Vault package and a reminder that dev-mode Vault persists nothing and secures nothing.
Ten containers, and the toy system uses about six on a normal day. The other four are the observability-and-optionality tax, prepaid.
The volumes tell you what the authors trust
The most quietly instructive detail in the file is which containers get persistent volumes. Answer: mongo and redis. That's it. The volume stanzas for consul, grafana, prometheus, rabbitmq and seq all exist — commented out.
Read as a statement of intent: your state survives a docker compose down; your telemetry does not. Logs, traces, metrics, dashboards, even undelivered broker messages — all ephemeral in dev, because in dev they should be. Every commented volume is also an invitation: the authors left the uncomment-me lines for the day you want your RabbitMQ queues to survive a restart. I have seen teams agonize over “should dev telemetry persist”; this file answers in comment syntax.
The corollary is sharper than it looks: with no rabbitmq volume, a compose restart deletes in-flight messages. If you are demoing the outbox, that is fine — the outbox exists precisely to re-publish. If you were testing without the outbox, your events are simply gone, and the demo just taught you the pattern's value the hard way. I genuinely wonder whether that pedagogy is intentional; it works either way.
Three copies of the truth: win, osx, lin
The compose folder has a structure the cloud-native years have made almost nostalgic: compose/win/, compose/osx/, compose/lin/ — three near-identical stacks. The difference is one hostname problem: containers reaching back to services running on your host. Prometheus runs inside the network but the three .NET services run on your machine (dotnet run, ports 5001–5003), so the scrape targets in prometheus.yml are docker.for.win.localhost:5002 on Windows and the platform equivalent elsewhere; likewise Consul health checks ping the host ("address": "docker.for.win.localhost" sits right in the Orders appsettings from chapter two).
Today you would write host.docker.internal once and ship one file. The triplication is a fossil of when that alias didn't exist everywhere — and a live lesson in the actual topology: half in-network, half on-host, with the boundary running straight through your scrape config. When your Prometheus targets show DOWN on a colleague's machine, this file is why.
The scrape config itself is four jobs — prometheus itself, deliveries, orders, pricing — at a 5s interval, against each service's /metrics. Which quietly resolves something the parent series left as an either/or: the sample's metrics section (AppMetrics, from part 20) runs with prometheusEnabled: true as its formatter while the standalone prometheus package section sits disabled — the two packages' overlap, visible only when you read config and compose together.
What this stack replaces, and what replaces it
It is worth saying what the compose file is for, because it is not deployment. It is the laptop-shaped staging environment: every backing service your production system has, in miniature, so that enabled: true on any capability has something to talk to. The alternative — mocking Consul, stubbing RabbitMQ — tests your stubs. This tests the wiring, which in a chassis is most of what there is to test locally.
Would I build this stack the same way in 2026? Mostly, with three edits. Jaeger and prometheus and grafana collapse into one OTel-native pipeline — an OpenTelemetry collector plus one backend takes three containers to one and matches where .NET's own instrumentation went, as the parent's retrospective argued. Consul and fabio I would cut from dev entirely — they're disabled anyway, and Kubernetes ate their production role. The three OS folders become one file. That leaves six containers, which is still 2:1 infrastructure to application, and that residue is the honest floor: a message-driven system with real observability simply is a stack, and .NET Aspire's dashboard-plus-orchestration is best understood as this exact compose file rewritten in C#.
One more thing the file teaches by omission: there is no container for the services themselves, no Dockerfile in the samples, no healthcheck stanzas, no depends_on. Startup ordering is your problem (the RabbitMQ client's retry loop from part 9 is what actually absorbs the race), and containerizing the apps is left as the exercise it always ends up being anyway.
The chassis made every capability one line of code and one config section. The compose file is where those lines come due — ten containers, two volumes, one lesson. Next chapter: with all of this running, how do you actually test a service built on a chassis — and what does all that injected machinery do to your test suite?